Timeline views
Thea shows the same events in several ways. Switch with the tabs above the timeline.
The tabs
Section titled “The tabs”- Timeline: the events on a time axis.
- Split: two parallel tracks, to compare two sides or themes.
- Key players: the people and organisations, grouped by side. See Players.
- Network: who is connected to whom. See Network view.
- Data: the underlying tables, to edit and export. See Data view.
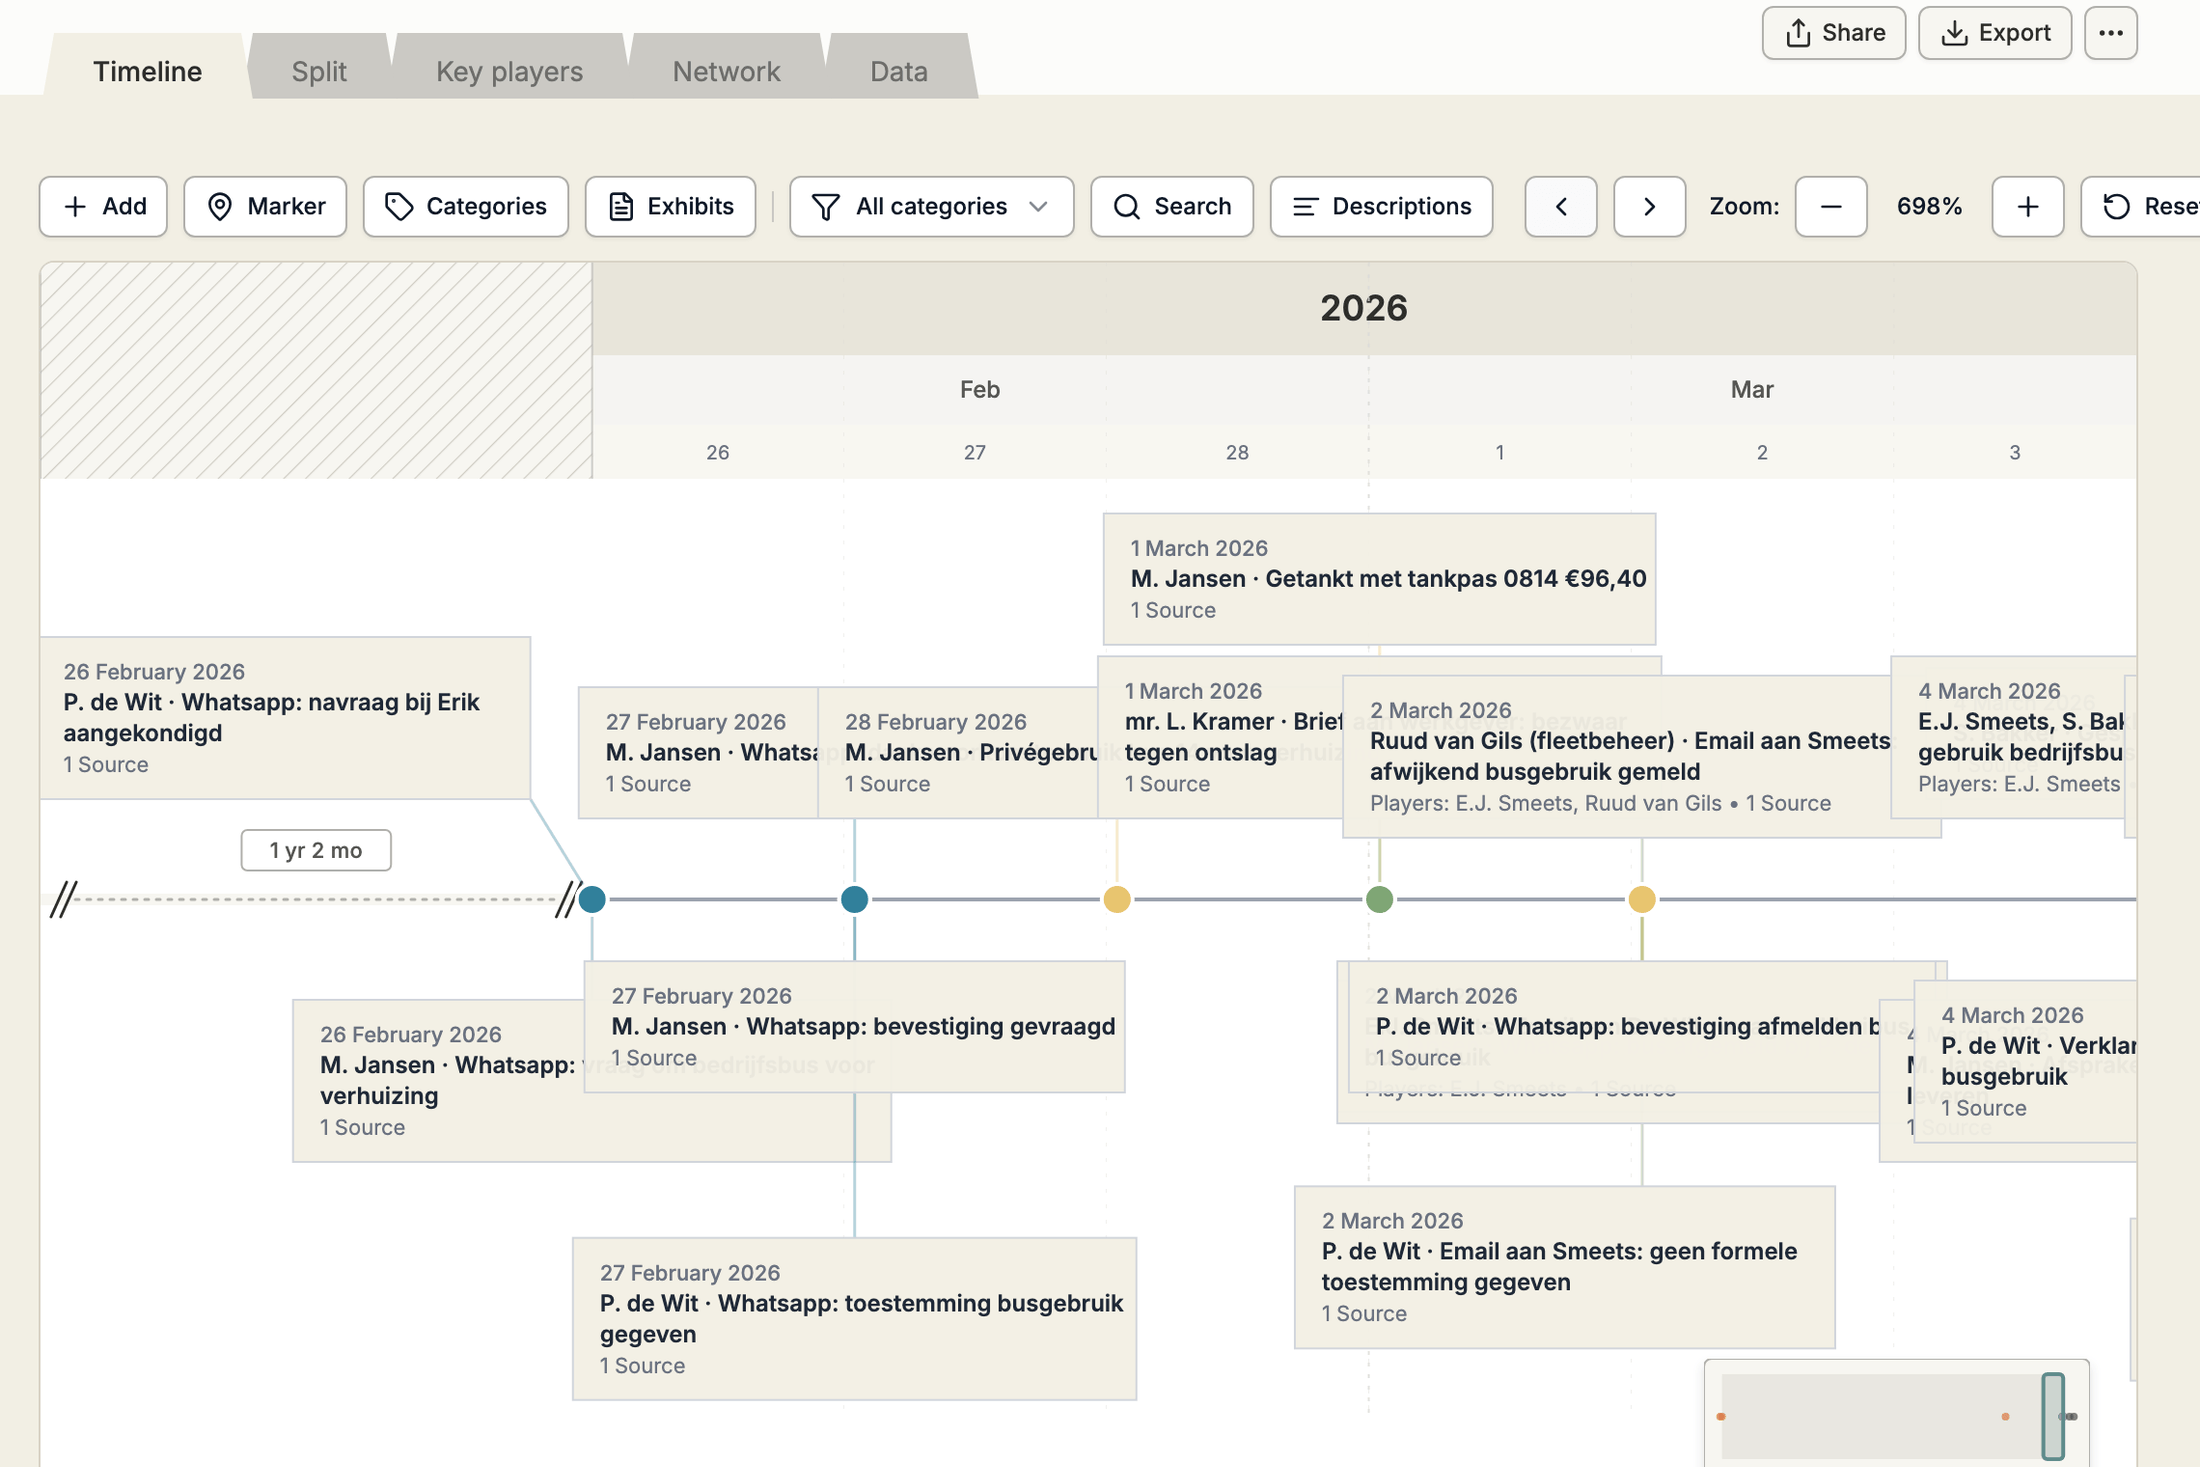
Layouts in the Timeline tab
Section titled “Layouts in the Timeline tab”The Timeline tab opens in Unified: all events on one horizontal axis, coloured by category. In full screen (the expand button at the top right of the chart) you can switch layout:
- Rows: one row per category.
- List: the events as a vertical list.
Move around
Section titled “Move around”- Zoom: the minus and plus buttons, or Ctrl/⌘ + scroll or pinch. Reset goes back to the default zoom.
- Pan: scroll sideways, use the arrow buttons, or drag the window in the minimap below the chart.
- Skip quiet periods: shortens long stretches without events, so busy periods get more room. On by default.
- Descriptions: shows or hides the event descriptions on the cards.
Arrange the cards
Section titled “Arrange the cards”Click Arrange to drag event cards to a better spot, for example when labels overlap. Cards stay in date order. Double-click a moved card to release it, or click Reset layout to release all. Press Esc to stop arranging.